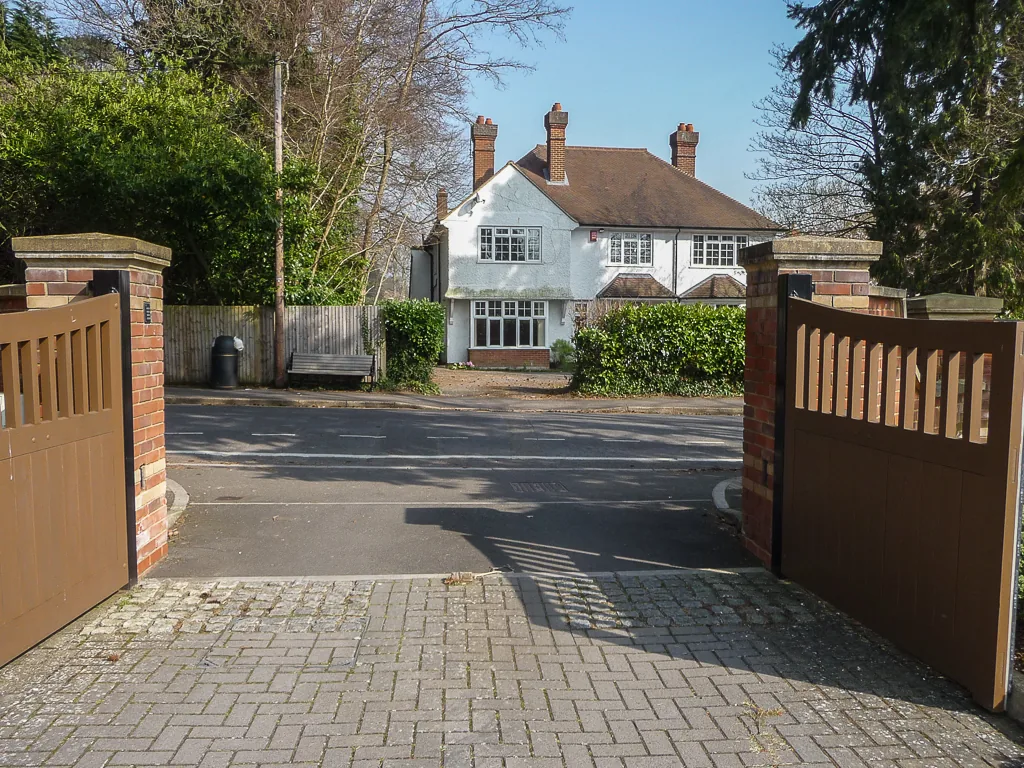

The average Hart home sold for £481,051 in July 2026, dearer than any other Hampshire district, and up 2.6% while the county managed 0.9%. Prices by type.
The average home in Hart sold for £481,051 in July 2026, and that is the highest figure of any district in Hampshire. It is also still going up. Prices here rose 2.6% over the year while Hampshire as a whole managed 0.9%, and while East Hampshire next door fell 1.2%.
Those are UK House Price Index figures, built from completed HM Land Registry sales rather than asking prices. They cover Hart district, which is Fleet and Church Crookham, Hook, Odiham and North Warnborough, Hartley Wintney, Yateley, Blackwater, Eversley and the villages between them. They do not cover Farnborough or Aldershot, which are in Rushmoor, and they do not cover Basingstoke. Hart has no town anywhere near the size of those three, and its average price is well above all of them.
One thing to know before reading any of it. The UKHPI average is a mean, not a median, so a few large sales pull it upwards.
The headline figures
| Measure | July 2026 |
|---|---|
| Average price, all property types | £481,051 |
| Change over 12 months | +2.6% |
| Change over the month | +0.1% |
| First-time buyer average | £358,898 |
| Former owner-occupier average | £581,194 |
| Index (2023 = 100) | 102.0 |
The index line is the one people miss. On the Land Registry’s scale, where the 2023 average is set at 100, Hart reads 102.0. Hampshire reads 97.9. The county as a whole has not got back to where it was three years ago. Only three of the eleven Hampshire districts have: Basingstoke and Deane at 103.5, Hart at 102.0 and Rushmoor at 101.2. Winchester, the district closest to Hart on price, reads 96.4.
The gap between the two buyer figures is the number that matters if you are moving within the district. A first-time buyer paid £358,898. Somebody selling one home here to buy another paid £581,194. That is a step of £222,296, and it explains a pattern local agents will recognise: people buy their first flat or terrace in Fleet, and their second move is often out to Basingstoke, Aldershot or Farnborough rather than up within Hart.
The premium is the same whatever you buy
| Property type | Hart | Hampshire | Hart premium |
|---|---|---|---|
| Detached | £791,813 | £624,115 | +27% |
| Semi-detached | £481,069 | £380,560 | +26% |
| Terraced | £384,668 | £302,346 | +27% |
| Flat or maisonette | £239,550 | £184,360 | +30% |
Most expensive districts are expensive in a lopsided way: they carry a premium on one kind of house and sit near the county average on the rest. Hart does not. It is between 26% and 30% above Hampshire on every single property type, from a flat to a detached house. There is no bargain corner of the market here. Whatever you are buying, you are paying about a quarter to a third more than you would for the same thing elsewhere in the county.
Two numbers put that in perspective. A semi-detached house in Hart averages £481,069, which is £116,733 more than the average home of any type anywhere in Hampshire. And a flat here averages £239,550, which is one of the few Hart figures that lands below a national benchmark: the England average for all property types is £293,479.
Where Hart ranks in Hampshire
| District | Average price | Change over 12 months |
|---|---|---|
| Hart | £481,051 | +2.6% |
| Winchester | £463,025 | +2.1% |
| East Hampshire | £440,541 | −1.2% |
| New Forest | £384,977 | 0.0% |
| Basingstoke and Deane | £370,223 | +1.0% |
| Test Valley | £368,131 | −0.6% |
| Fareham | £333,599 | +1.4% |
| Rushmoor | £326,771 | +0.5% |
| Havant | £315,820 | −1.2% |
| Eastleigh | £310,283 | +2.6% |
| Gosport | £240,696 | +3.4% |
Hart is first on price. It is not first on growth: Gosport, the cheapest district in the county, rose fastest at 3.4%, and Eastleigh matched Hart’s 2.6%. Hart is also 38th dearest of the 295 English local authority districts.
The margin over Winchester is £18,026. The margin over the district Fleet actually borders is far larger: Rushmoor averaged £326,771, so the gap between Fleet and Farnborough is £154,280 across a boundary you can walk over.
Hart is not, however, the dearest thing on every side of it. Cross the county line at Eversley into Berkshire and Wokingham averaged £496,537, which is higher than Hart, though it fell 0.9% over the year while Hart rose. Surrey Heath, which Blackwater and Yateley run straight into, averaged £457,988 and was the fastest-rising district in the whole area at +4.0%. Bracknell Forest averaged £395,413 and fell 1.4%.
Against the wider picture, Hart is £116,715 above Hampshire, £100,173 above the South East average of £380,878, and £187,572 above the England average of £293,479, which is about two thirds more.
What it means for you
If you are buying, the premium is close to uniform, so trading down a property type saves you the same proportion here as anywhere. What it does not do is get you out of the premium. The real lever is the boundary: Rushmoor is £154,280 cheaper on average and Fleet’s northern edge is minutes from it. Before you commit to an address, check what is proposed nearby on our Fleet planning page.
If you are selling, the market has been with you all year, in a county where it has not been with everyone. Three of the eleven Hampshire districts were lower in July than a year earlier. Hart was not one of them.
If you are staying put, your home is worth more in cash terms than it was in 2023, which most of Hampshire cannot say. What holds that up is not mysterious. It is the train: Waterloo in forty-two minutes from Fleet, with Hook and Winchfield on the same line.
Frequently asked questions
What is the average house price in Fleet?
The average home in Hart district, which contains Fleet, sold for £481,051 in July 2026, according to the UK House Price Index, built from completed HM Land Registry sales. That covers every property type across the district, flats included. The Land Registry does not publish a separate monthly average for the town of Fleet on its own.
Are Fleet house prices rising or falling?
Rising, slowly. Prices were up 2.6% in the year to July 2026 and 0.1% in the month of July alone, at a time when Hampshire as a whole was up 0.9% and England 1.1%. The annual rate had narrowed in every month from January to June, and July was the first month of 2026 in which it went up rather than down.
Is Hart the most expensive district in Hampshire?
Yes, on the latest figures. Hart’s £481,051 is the highest of the eleven Hampshire districts, ahead of Winchester at £463,025 and East Hampshire at £440,541. It is not the dearest area on all its borders, though: Wokingham, over the Berkshire line, averaged £496,537.
How much is a house rather than a flat in Hart?
A terraced house averaged £384,668, a semi-detached £481,069 and a detached house £791,813 in July 2026. A flat or maisonette averaged £239,550, and it is flats that pull the district-wide average of £481,051 down to roughly the price of a semi. The two figures are £18 apart.
How much cheaper is Farnborough than Fleet?
Rushmoor borough, which is Farnborough and Aldershot, averaged £326,771 in July 2026 against Hart’s £481,051. That is a difference of £154,280, or about 32%, across a district boundary at the edge of Fleet.
Where can I check what a specific Fleet house sold for?
Every completed sale in England and Wales is public. Search a street or an address free on the HM Land Registry Price Paid service.
Sources
- UK House Price Index, Hart (ONS / HM Land Registry) for the district average, property-type and buyer-type figures and the annual and monthly changes.
- Land Registry UK HPI open data, Hart, July 2026 for the underlying figures quoted here, and the equivalent Winchester, East Hampshire, New Forest, Test Valley, Basingstoke and Deane, Rushmoor, Fareham, Havant, Eastleigh, Gosport, Surrey Heath, Wokingham, Bracknell Forest, Hampshire, South East and England records for the comparison tables.
- UK HPI full data file, July 2026 for the ranking among the 295 English local authority districts.
- HM Land Registry Price Paid search to check any individual address.
Figures are provisional, are revised as more sales complete, and the index runs two to three months behind. Confirm the latest numbers against the linked ONS and Land Registry sources before making a decision. Our fuller monthly report is Hart house prices, July 2026. What is being built next is on Fleet planning; what the commute costs is on Fleet to London trains.
Have your say